


The idea that Maine has a longer coastline than its leggy western cousin, California, seems, on its face, ridiculous. But it’s true. Sandwiched between Eliot and Eastport lie 3,478 meandering miles, a sandy, craggy mix of inlets and ledges, coves and bays, rivers and creeks. The tide wanders in and out among them, rising against the fjard walls of Somes Sound and rolling over the soft sands of Scarborough Beach.
Yet for all those many miles, there are just five long-term tide gauges collecting historical data, said Gayle Bowness, municipal climate action program manager at the Gulf of Maine Research Institute.
The complexity of the coastline also means that the height of the tide at a particular spot may be higher or lower, or happen an hour later or earlier, than what is predicted by a tide gauge tens of miles away.
That’s a problem, especially for communities that are designing complicated, expensive infrastructure projects around predictions that may be off by either height or timing.
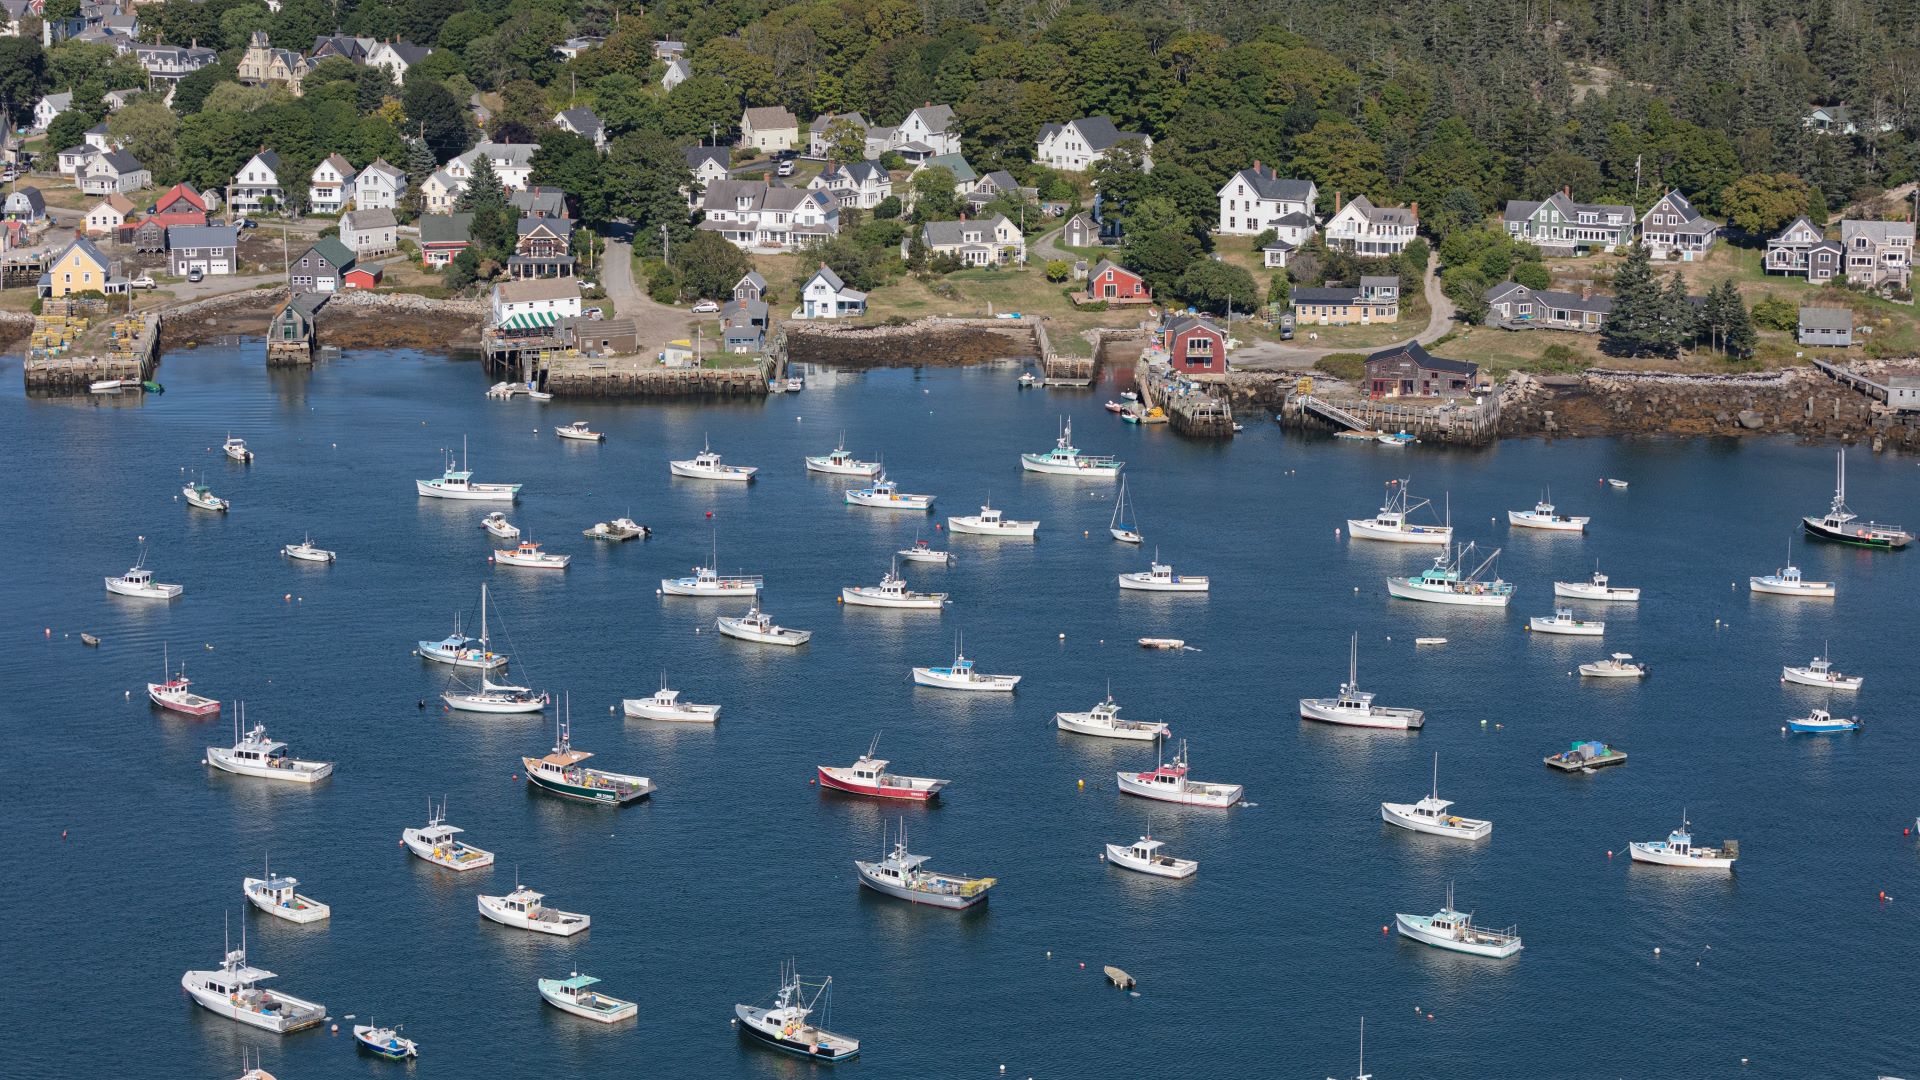
A few years ago, the Vinalhaven Sea Level Rise Committee set out to solve the problem with a citizen science project. It was obvious that areas of the island were flooding more often than in the past during high tides and storm surges.
But just how often, and by how much? Were the tides higher or lower than the predictions made by the nearest tide gauge, in Bar Harbor, several bays away?
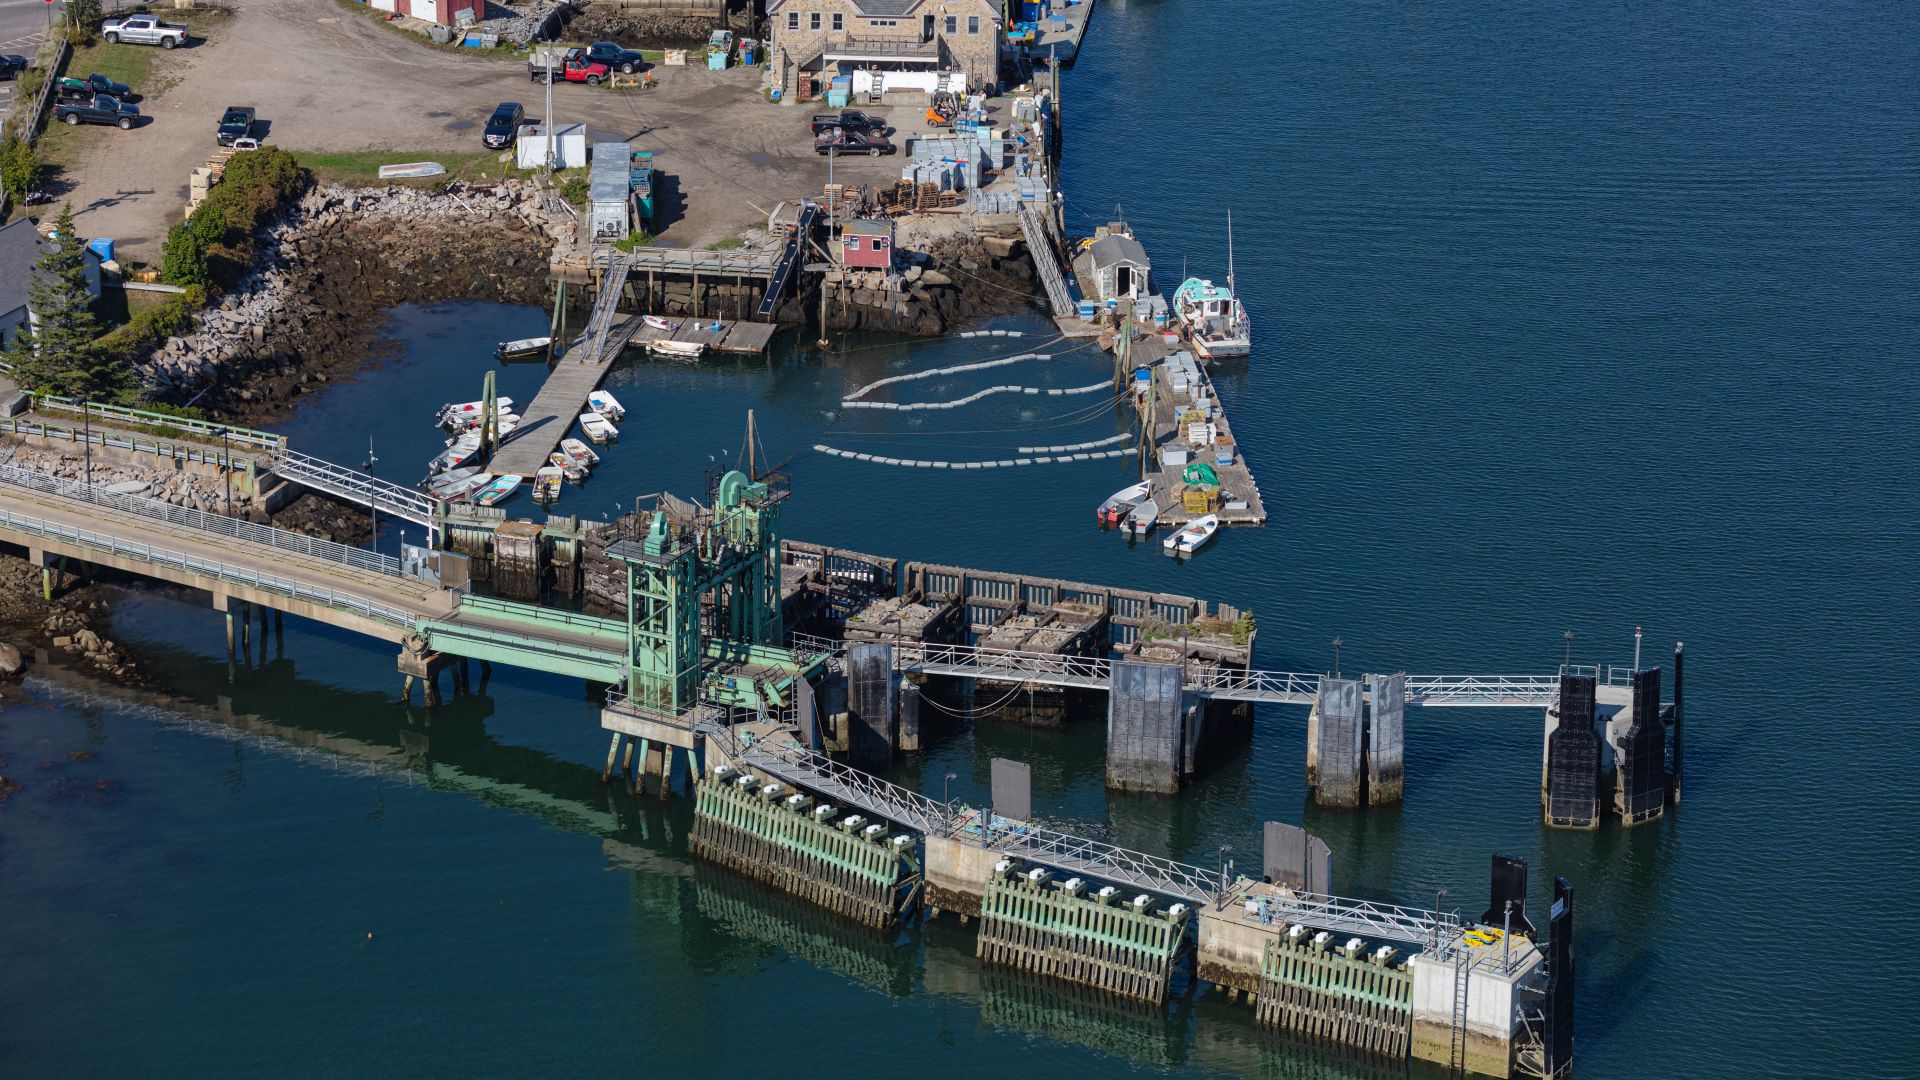
The committee, a mix of seasonal and year-round residents, chose seven locations around the island that were particularly susceptible to the impacts of coastal flooding. They focused on those places that were associated with critical infrastructure, like the ferry that provides a lifeline to the mainland, and that could be safely accessed by volunteers, who would eventually be driving or walking to them during high tides, often in the middle of the night, to collect data.
Looking to the North Carolina King Tides Project for inspiration, the committee calculated the mean high-water level (the average of all the high-water heights measured from 1983 to 2001, according to the National Oceanic and Atmospheric Administration) for each chosen location. That would be the “zero point.” Then members pasted printed decals — essentially giant rulers, marked in one-inch increments — to PVC boards. The giant rulers, installed in September 2020, allow for measuring tides up to six feet above mean high water.
After carefully marking the zero point at each chosen location, volunteer “TideTrackers’” used stainless-steel screws to affix the gauges to pilings and utility poles around town. In the meantime, the Knox County Emergency Management Agency set up a platform for data collection using the ArcGIS Survey 123 app, which would allow the TideTrackers to easily submit photos, tide data, weather observations and other information.
“We wanted to see what our actual data was and the change over time,” said Margaret Qualey, who moved to the island with her husband in 1996 when he took a job as the ferry captain.
Seeing trends in the data will take years, said Qualey. In the meantime, the committee hopes the project will engage local residents and students in “citizen science” and make changes more readily visible.
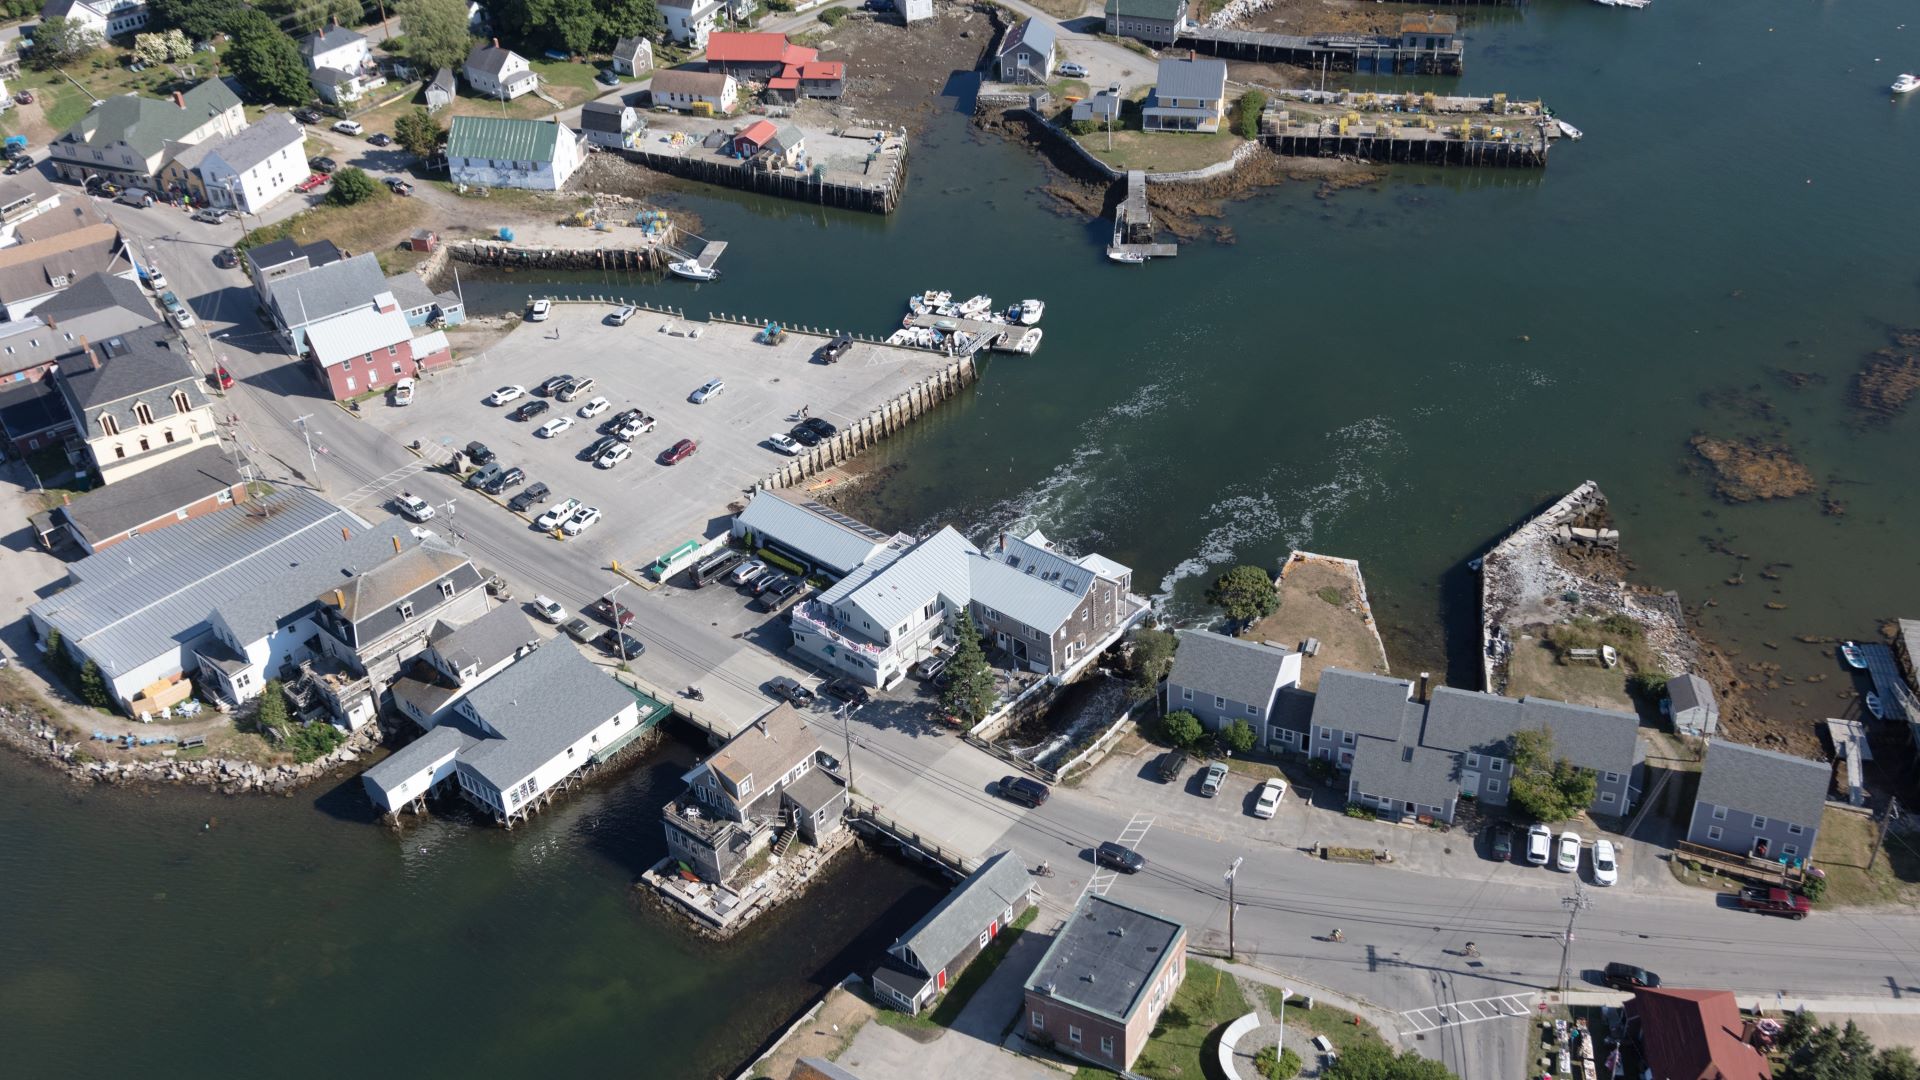
Some summer residents, for instance, may not realize that the downtown parking lot floods during high tides and spring storms, said Qualey. Photos taken by TideTrackers can easily convince those skeptics. “It’s the social impact of getting people to even talk about it,” said Qualey.
Even in the short time since the gauges have been installed, the TideTrackers have found that tides in some areas are quite different than what’s predicted.
“Tides in different areas can be an hour after predicted tide,” said Qualey, “because the water has to go up a cove and around the corner. So it’s been sort of very enlightening that way.” Accurate information is vital for a community that lives by the tides and the weather, she added.
Accurate data is also essential not only in planning for infrastructure to manage sea level rise but for convincing state and federal agencies to fund those projects, said Hannah Baranes, a postdoctoral researcher at the Gulf of Maine Research Institute. She’s working on a project she hopes will help communities better predict tides and flooding up and down the coast.
“To really get good, spatially continuous information on flooding,” said Baranes, “you need to have a really dense distribution of tide gauges, which we really don’t have right now.”
Even in Portland, which has a historical tide gauge, said Baranes, tides and flooding often look very different than predictions, depending on where you’re standing. Tides in Back Cove, for instance, may be different than predicted for the Ocean Gateway pier.
“If it’s hands on and you go out and you can actually see it for yourself,” said Qualey, “It somehow has a bigger effect on you.”